Creator analytics is the difference between guessing and knowing. Most sellers collect data but do not read it correctly: they look at views and ignore the metrics that actually predict future performance. This article shows you which metrics belong on your creator analytics dashboard, how to read them, and how to use them to decide which creators to renew, scale, or drop.
Why Most Creator Dashboards Are Useless
Most creator dashboards show views, likes, and follower count. These metrics look impressive but tell you nothing about whether the creator actually sells. A dashboard that reports vanity metrics is a dashboard that helps you make bad decisions.
A useful dashboard reports metrics tied to business outcomes: cost per order, conversion rate, repeat purchase rate, and content-to-sale attribution. These metrics tell you which creators drive revenue, not just attention. If your dashboard does not connect creator activity to sales, you are managing by vanity.
The failure is structural, not technical. A view counter answers the question of whether people watched, which is not the question you bring to a dashboard. You bring questions like should this creator get more budget and should we renew this partnership next quarter. Those questions need denominators and time frames: cost, conversion, and attribution windows. Yet most dashboards present a raw follower number accumulated long before your campaign existed, and a raw view count that spiked because the creator bought reach. The dashboard is not wrong, it is answering a different question than the one you are asking. Until the metric choice changes, no amount of chart polish fixes your decision quality.
Watching this play out on a real account makes the point concrete. Two beauty creators each received a $200 fee plus free product in the same campaign week. Creator A has 120,000 followers and posted a video that reached 40,000 views; Creator B has 18,000 followers and reached 7,000 views. A follower-based dashboard crowns Creator A the winner and asks for more of the same. An outcome-based dashboard shows Creator A produced 3 orders while Creator B produced 14 orders, which puts A’s cost per order above $80 and B’s near $20. The two dashboards recommend opposite decisions, and only one of them is connected to your profit and loss.

Analytics starts with proper funnel tracking. See our guide on creator funnel data to set up the foundation.
The Five Metrics That Belong on Your Dashboard
Build your dashboard around five metrics that directly inform creator decisions. Each metric answers a specific question, and together they give you a complete picture of creator performance.
| Metric | What it answers | Decision it drives |
|---|---|---|
| Cost per order (CPO) | How much did each sale cost? | Budget allocation |
| Conversion rate | What percentage of viewers bought? | Creator quality |
| Content-to-sale attribution | Which video drove the sale? | Content scaling |
| Repeat purchase rate | Did buyers come back? | Long-term value |
| Engagement quality | Are comments showing buying intent? | Content optimization |
Add the metrics as a team, not as a report. The five metrics interoperate: conversion rate without cost per order tells you the creator is talented but not whether they are affordable; repeat purchase without attribution tells you the audience is loyal but not which content earned them. A single metric is a rumor, five metrics read together is a verdict. Decide the definition of each metric before the first data arrives, because conversion can mean checkout reached, paid orders, or shipped orders, and the three numbers are different enough to change tiering decisions. Write the definitions next to the metric names on the dashboard, so next quarter’s analyst does not silently change the formula.
Tier your creators by counting rules instead of judgment calls. Start with cost per order as the primary filter because it summarizes spend efficiency, then use conversion rate to explain the result: a high CPO with high conversion usually means the audience is right but the reach is expensive, while a low CPO with low conversion means cheap traffic that never converts. Add repeat purchase and engagement quality as tiebreakers when two creators show a similar CPO. With five metrics, a decision that used to depend on a vibe becomes a process any team member can follow.
How to Read Cost Per Order Across Creators
Cost per order is the most direct measure of creator efficiency. Calculate it by dividing total creator cost (fee plus commission plus sample cost) by the number of orders attributed to that creator. A creator with a CPO of $8 is more efficient than one with a CPO of $25, even if the second creator generated more total orders.
Compare CPO across creators in the same campaign to identify the most efficient partners. Then compare CPO across campaigns for the same creator to see if their efficiency is improving or declining. A creator whose CPO rises over three campaigns is losing audience fit, and the data tells you to adjust the brief or move on.
Beware CPO distortions before you compare. A creator launching during a platform-wide sale weekend inherits conversion it did not earn, and a creator running in the final two weeks of a campaign faces an exhausted audience. Compare like for like: same product, same audience type, same selling window. Small order counts also mislead, because a creator with 4 orders at a $9 CPO is not more efficient than one with 45 orders at an $11 CPO; the second number is a measurement, the first is a lottery ticket. Set a minimum order floor, for example 10 orders, before a CPO reading is treated as reliable.

Read the CPO trend line, not the single point. A first-campaign CPO above your target is common and rarely fatal; it is the second campaign that reveals whether the creator learned the product or stayed generic. Plot CPO across three campaigns with the same brief quality: a rising line means audience fit is fading or the price point drifted, a falling line means the creator is compounding and deserves a higher fee tier. Present the trend in the creator review meeting, because a single number starts an argument while a line starts a conversation about what changed and why.
Conversion Rate: The Creator Quality Signal
Conversion rate measures the percentage of viewers who made a purchase after watching the creator video. A high view count with a low conversion rate means the audience is interested but not buying. A moderate view count with a high conversion rate means the creator has a hot audience that trusts their recommendations.
Use conversion rate to tier creators: those above 2% are your conversion engine, those between 0.5% and 2% are mid-tier, and those below 0.5% are reach partners. Allocate budget by tier: spend more on conversion creators for sales and on reach creators for awareness.
Split conversion into traffic quality and content quality before deciding who to fix. If views are high but conversion is low, the video reached the wrong people or the offer was weak, which points to targeting and offer rather than the creator. If views are moderate and conversion is high, the creator has a warm audience and the lever is frequency: more videos, more products, or a dedicated discount code to convert that audience faster. Naming which half of the funnel failed prevents two classic mistakes: firing a creator whose content was fine, and keeping a creator whose traffic was bought.
Use conversion levers from the brief side. A three-second mention of a promo code, a pinned comment that answers the top five buying objections, and a stated stock or deadline cue, such as a limited quantity this week, all move conversion without changing the creator’s style. Benchmark against your own category: impulse categories like beauty and apparel can hold a 2% threshold, while considered purchases need a lower bar because the decision cycle is longer. Take your own averages rather than industry tables, because your traffic mix and price point make every benchmark category-specific.
Content-to-Sale Attribution: The Hardest but Most Valuable Metric
Attribution connects a specific video to specific sales. Without it, you know the campaign generated orders but not which content drove them. Use unique tracking links, promo codes, or UTM parameters for each creator to attribute sales accurately.
In DAMI, each creator profile links to the store performance data, so you can see which videos drove which orders. This attribution is the backbone of every renewal decision: a creator whose content consistently drives sales gets renewed; one whose content generates views but no sales gets a different brief or a different product.
| Attribution level | What you can decide | Limitation |
|---|---|---|
| Promo code | Direct sales per creator | Code leakage to forums |
| UTM tracking | Traffic source per creator | Requires proper setup |
| DAMI store link | Sales attributed to creator | Most accurate |
Accept that attribution is rarely a single touch. A user watches Creator A’s unboxing on Tuesday, sees Creator B’s comparison video on Friday, and orders from a brand search on Sunday. Choose a method that survives this reality: promo codes capture the last click, while order-source surveys and brand-search spikes capture the influence. The question that matters for the decision is not who gets one hundred percent of the credit, it is which creators consistently appear in the sales journey. A creator who is regularly present in the path even without the final click is earning attention your next campaign should reinvest in.
Attribute within the campaign window, not forever. Content that posts two months before a seasonal peak shows rising sales that belong to the season, not to the storyline. Compare each creator against the campaign baseline by time window: sales in the 14 days after the video posts against the same number of days before posting. Remove overlaps when a second campaign for the same product runs concurrently, because blended numbers cannot tell you which video earned the order. Clean attribution data makes renewal reviews defensible, which matters the moment a disappointed creator disputes the numbers.
Repeat Purchase Rate: The Long-Term Value Signal
Repeat purchase rate tells you whether the creator audience is building a customer base or just making one-time purchases. A creator who drives 100 first-time buyers with a 30% repeat rate is more valuable than one who drives 200 first-time buyers with a 5% repeat rate, because the first creator is building a customer base that compounds.
Track repeat purchase rate at 30, 60, and 90 days after the creator video posts. The 30-day rate shows immediate loyalty; the 90-day rate shows lasting value. Creators whose audiences repeat-purchase are long-term partners worth investing in.
Match the repeat window to the product life cycle. Consumables like skincare and food show repeat purchases inside 60 days and reward creators whose audiences are returning shoppers. Durable goods bought once every few years make a 90-day repeat rate look discouraging even when the creator is excellent, so use a longer lookback and measure repeat across total spend rather than only the first repurchase. The practical takeaway: before drawing conclusions about creator value, decide whether your category repeats fast or slow, and set the window accordingly.
Turn repeat rate into roster decisions. A creator with strong repeat purchase justifies a lower-cost acquisition package, because each new buyer from that audience compounds over time. Rank creators by a blended 30/60/90-day repeat score: the top ranks get longer renewals and an early claim on next campaign slots, while the bottom ranks get one proof campaign before their volume share shrinks. Publish the rule, so every creator knows that repeat customers, not just first sales, decide who scales. That visibility changes how creators talk about your product to their audience, which is exactly the behavior you are trying to buy.
Engagement Quality: The Leading Indicator
Engagement quality goes beyond like counts. Read the comments on the creator video: are people asking where to buy, comparing prices, or tagging friends? These are buying-intent signals that predict conversion before the sales data comes in.
Log engagement quality in DAMI as a qualitative note alongside the quantitative metrics. A creator whose videos generate buying-intent comments is a creator whose audience is ready to purchase, even if the conversion rate has not yet caught up.
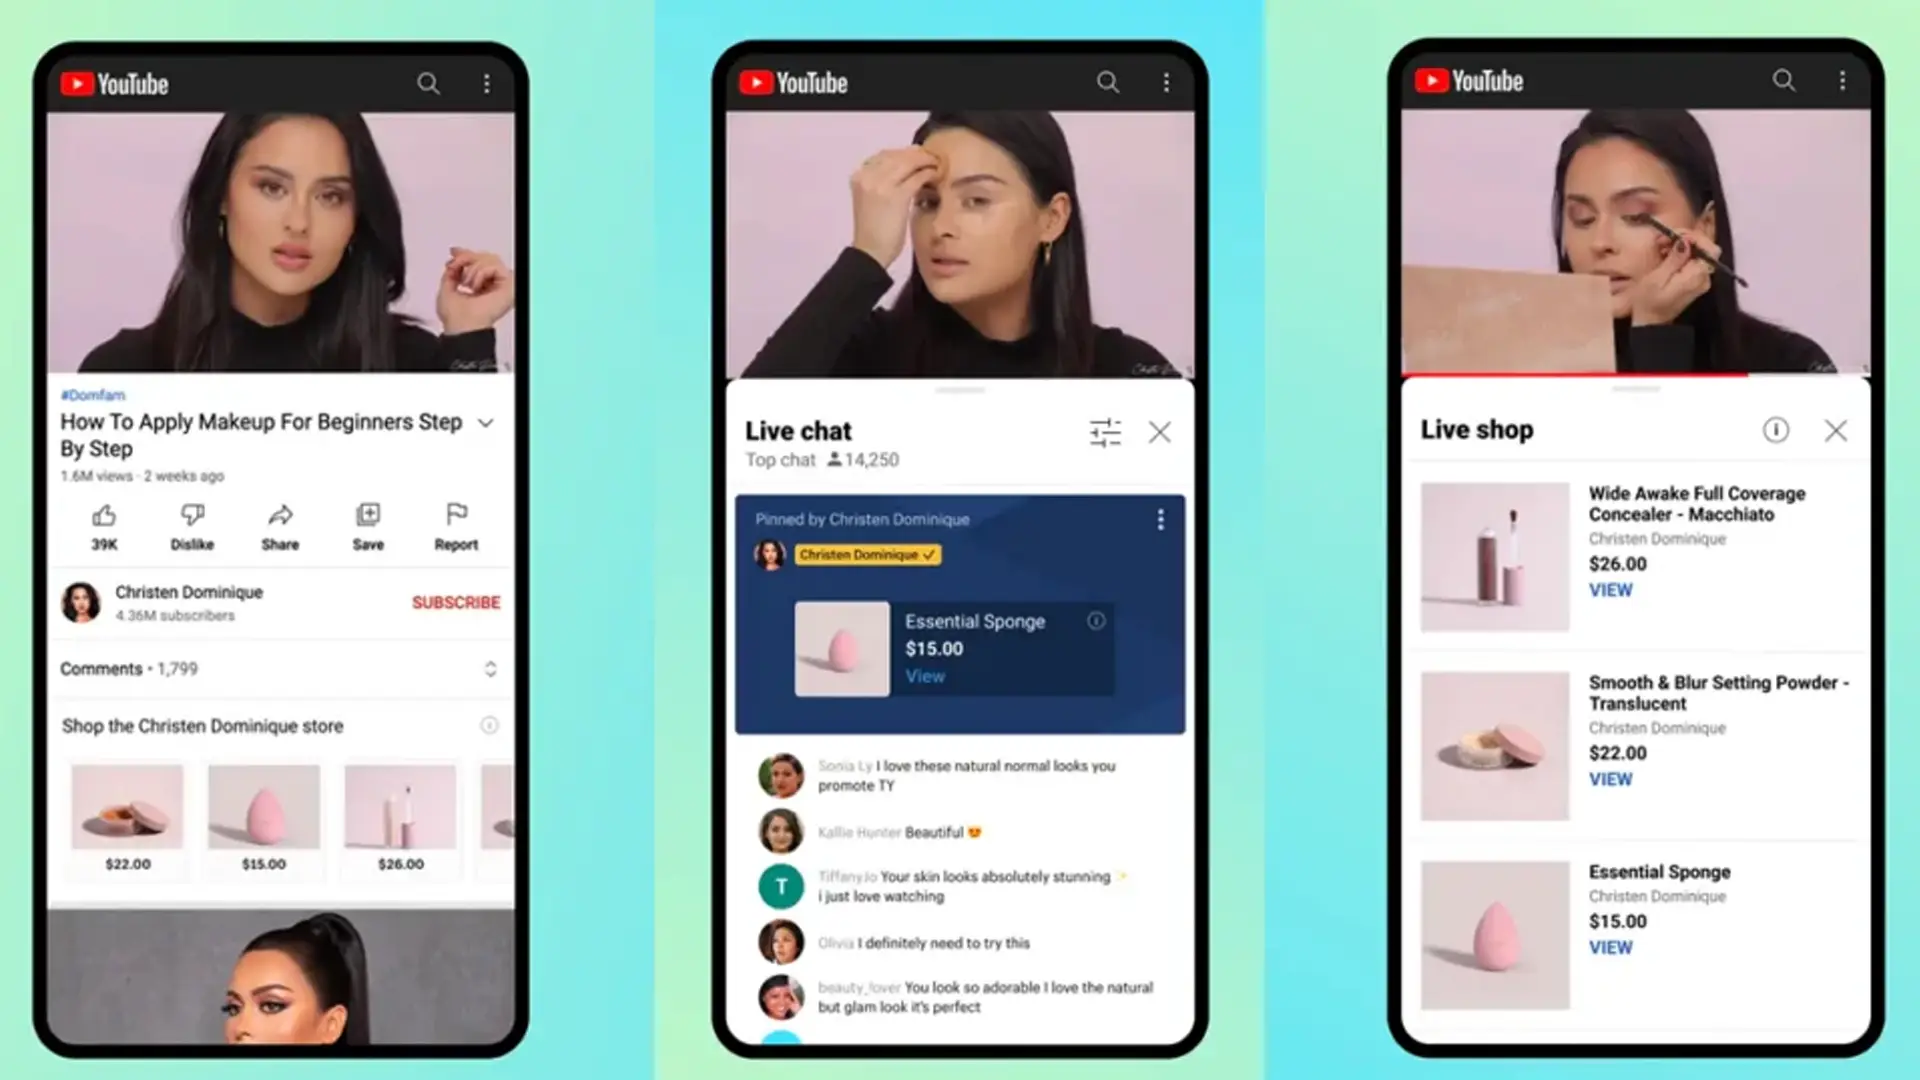
Grade comments, do not just count them. Classify each comment into three buckets: buying intent, where the viewer asks about price, size, stock, or how to order; objection, where the viewer worries about quality, shipping, or the claim; and noise, which is tags, emojis, and off-topic chatter. A video with 200 comments, of which 40 show buying intent and 15 repeat the same objection, is a conversion problem waiting for a fix: pin a comment that answers the objection and watch the intent ratio shift. The mix of buckets, rather than the total count, tells you whether the audience is moving toward the register.
Use engagement quality as an early warning system. Buying-intent comments usually appear within 48 hours of posting, which is days before sales data stabilizes. A creator whose early comments are a healthy mix of intent and curiosity is heading toward solid conversion, while a wall of price complaints predicts weak order flow. Log a qualitative note per creator in DAMI after each video so the pattern accumulates, and after three videos with the same comment profile, the signal is strong enough to change the brief, the product, or the creator tier before the next campaign spends a dollar.
Questions Sellers Ask
How often should I review the analytics dashboard?
Weekly during active campaigns, and a full review after each campaign ends. The weekly check catches underperforming creators early; the post-campaign review informs renewal decisions.
What if my dashboard only shows views and likes?
Upgrade to a system that connects creator activity to sales. DAMI links creator performance to store data, so you see the full funnel, not just the top.
Should I share the dashboard with creators?
Share performance summaries, not the full dashboard. Creators appreciate knowing how their content performed, but the strategic data (CPO, repeat rate) is for your internal decisions.
How do I handle creators whose numbers look great but returns are high?
High conversion with high returns usually means the creator oversold the product. Add refund and return rate as a downstream guardrail, and flag any creator whose adjusted CPO after returns breaks the target. Review the content behind those returns to catch overpromises, then edit the brief for the next round. A creator who sells strongly but returns at twice the store average is costing you more than the dashboard shows.
What is the smallest dashboard a two-person team can manage without drowning?
Keep four rows per active creator: cost per order, conversion rate, orders in the last 7 days, and days since the deadline. Everything else belongs in a campaign note. A small team should act on few signals quickly; a twenty-metric dashboard that nobody reads on Fridays is worse than a four-row one that gets one honest review per week. Add a metric only when a decision currently fails because the data is missing, and revisit the dashboard every quarter to delete any row that has not changed a decision.
See your creator analytics in one dashboard. Try DAMI for free and track the metrics that actually predict creator performance.
Conclusion
Creator analytics is about connecting creator activity to business outcomes. Build your dashboard around cost per order, conversion rate, attribution, repeat purchase rate, and engagement quality. Read the data to tier creators, allocate budget, and make renewal decisions. The sellers who manage by metrics instead of gut feeling build a creator program that compounds in efficiency with every campaign.
Analytics compounds only when it changes action. Any dashboard is a map, and a map earns its place when it changes the route. Update the dashboard weekly during campaigns, revisit the metric definitions each quarter, and rebuild every decision from the data: renew, scale, brief differently, or drop. Operators who master this loop do not merely track performance, they build a roster where every creator investment is measurable and every renewal is earned. That is the difference between managing creators and managing bets.