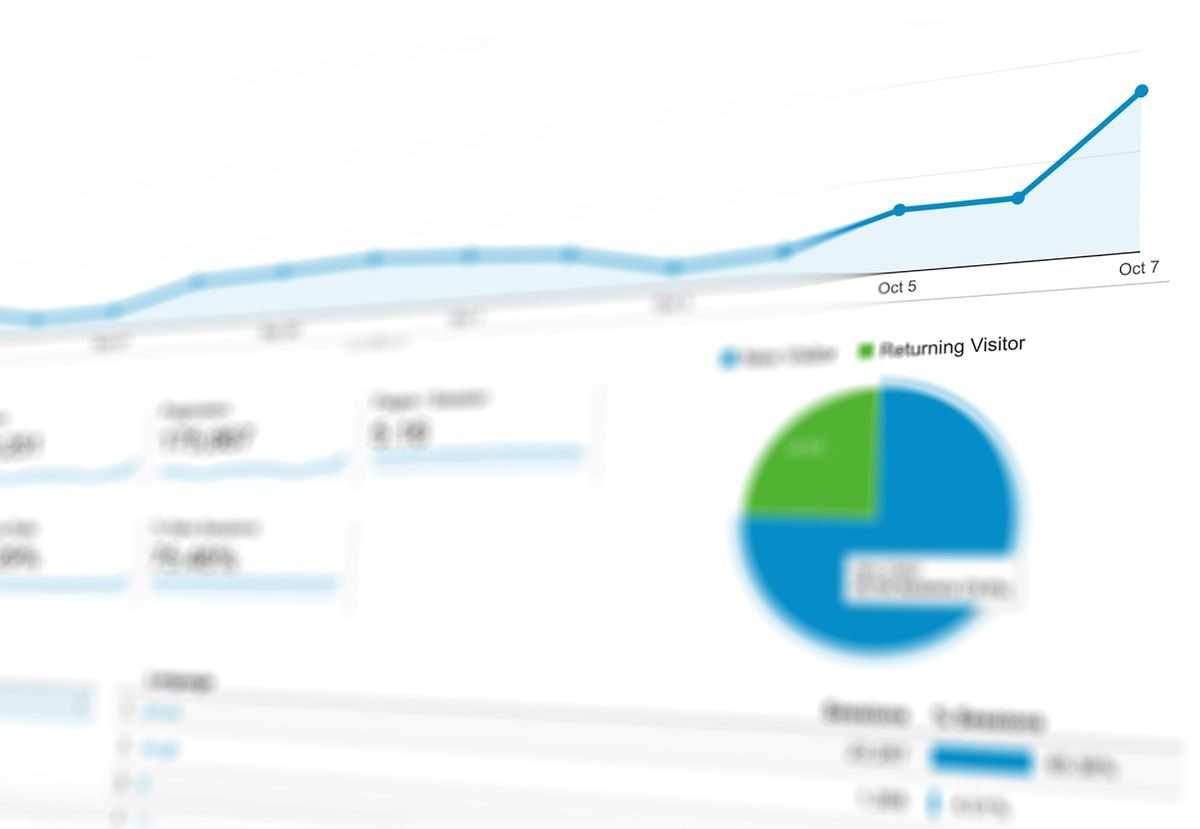
A two-person team watched their GMV fall for two weeks and rewrote every hook they had. The rewrite did nothing, because nothing was wrong with the hooks. The short video overview they had been staring at the whole time showed the cause three columns to the left: exposure had dropped by a third, because they had published four videos instead of eleven. Same click rate, same conversion, less inventory.
That mistake is not a reading error. It is a category error — using a trend view to answer a question that only a per-video view can answer.
This is written for the seller who posts through creator accounts rather than one brand account, ten to fifty SKUs, one or two people between them, US or Southeast Asia. At that size nobody has time to open every video. The overview is the only screen you look at daily, so it is worth knowing exactly what it is for before trusting it with a decision.
The six numbers, and the one question they answer
A short video overview carries GMV, average daily visitors, total SKU orders, product exposure, clicks and click rate, drawn as trend lines and filtered by period and account type. Six numbers, one screen.
They answer exactly one question well: compared with the last period, where did the chain break? The chain is exposure, then click, then visit, then order. Each number is a station on that line, and the value of the screen is that it shows all four stations moving together. A single number falling is noise. Two adjacent numbers falling in sequence is a diagnosis.
What the overview does not do is rank anything. It has no per-video row, no per-creator row and no per-product row. It will tell you that click rate dropped across the account set; it will not tell you which video dragged it down. That is a different screen, and mixing the two is the most common way a small team spends a week fixing the wrong thing.
Reading the line in the order the money moves
Start at exposure and walk right. It takes about a minute and it prevents most bad decisions.
If exposure fell and click rate held, output fell. Nothing about the content got worse; there is less of it, or fewer accounts posted. The fix is publishing volume or account coverage, not creative.
If exposure held and click rate fell, the covers or the first frame stopped working. That is a creative problem, and it is worth acting on the same week.
If click rate held and visitors fell anyway, the traffic is arriving from somewhere that does not click — usually a spike from one account that has since gone quiet.
If visitors held and orders fell, the problem has already left the video and moved to the listing or the price. Rewriting hooks at this stage is the two-week mistake in the opening, and it happens because the overview shows all six numbers at once and the loudest one is GMV.
A worked example makes the walk concrete. Exposure falls from 41,000 to 27,000, click rate holds at 2.1%, visitors fall by the same third, orders fall by a third. Three stations moved together and the fourth held, which is a volume story from start to finish and the only lever is publishing more. The same screen with exposure flat and click rate at 1.2% is a creative story, and the lever is the cover frame. Two identical-looking drops in GMV, two completely different weeks of work. Separating them before anyone starts rewriting is the entire job of the short video overview.
| What you see | What it usually means | Where to act |
|---|---|---|
| Exposure down, click rate flat | Fewer videos or fewer accounts posting | Publishing volume, account coverage |
| Exposure flat, click rate down | Covers or opening frame stopped working | Creative, first two seconds |
| Click rate flat, visitors down | Traffic depended on one account that went quiet | Account mix |
| Visitors flat, orders down | Listing, price or stock | Product page, not video |
| Everything flat, orders down | Check the period filter before anything else | Re-read the screen |
What the overview cannot see, and what to open instead
Three questions it will never answer, no matter how long you stare at it.
Which video deserves a second round of spend. That needs per-video data — GMV, GPM, plays, click rate, visitors, orders and the product each video was attached to, sortable by revenue. GPM is the number that makes videos comparable to each other, because it normalises by views instead of rewarding whoever got lucky with distribution. In DAMI those rows carry GPM beside GMV for exactly that reason.
Which creator is worth a second sample. Same screen, sorted by GMV rather than by views. A creator with modest views and a high GPM is a better second sample than one with ten times the views and nothing sold, and the overview cannot distinguish them because it has already averaged them together.
Which product is carrying the account set. That is SKU-level detail, not video-level, and it is the number that should decide what gets remade next month.

Using the overview as a trigger rather than a report
The useful habit is to give the overview a job it can actually do: deciding when to open the detail screen. Look at it in the same order every day, and only open the per-video view when two adjacent stations moved in the same direction. On a normal day the whole check takes under two minutes.
DAMI’s short video overview and the detail screen sit in the same workspace, with the same period and account-type filters carried across, so moving from the trend to the row is one click rather than a re-export. The per-video numbers are also what the scheduling side feeds back into, which is how a remake decision gets made from data instead of from memory.
FAQ
Should I check the overview daily or weekly?
Daily for the two-minute walk, weekly for a decision. Daily movement inside a week is mostly noise from posting time; a full week against the previous one is where the trend lines become readable. DAMI’s overview is filtered by period and account type, so the walk is the same few clicks every morning.
Why does my GMV look higher on the overview than in my payout?
The overview tracks sales, not settlement. Refunds, taxes and shipping are deducted on the financial view, not here. Reading the overview as profit is how a growing account ends up convinced it is making money.
Does filtering by account type change the comparison?
Completely. A creator account and a brand account have different baseline exposure, so comparing a mixed period against a filtered one produces a drop that exists only in the filter. Pick one basis and keep it for the comparison you are making.
Open the overview once a day for a week and write down which of the four stations moved first each time. That habit is worth more than any single report, and it is what the short video overview was built to support — trend first, detail on demand. Which of your videos actually sold something is the follow-up question, and which SKU actually earns is the one after that. The DAMI analytics workspace is where the trend line and the per-video rows share one set of filters, or you can create an account and read your own chain this week.